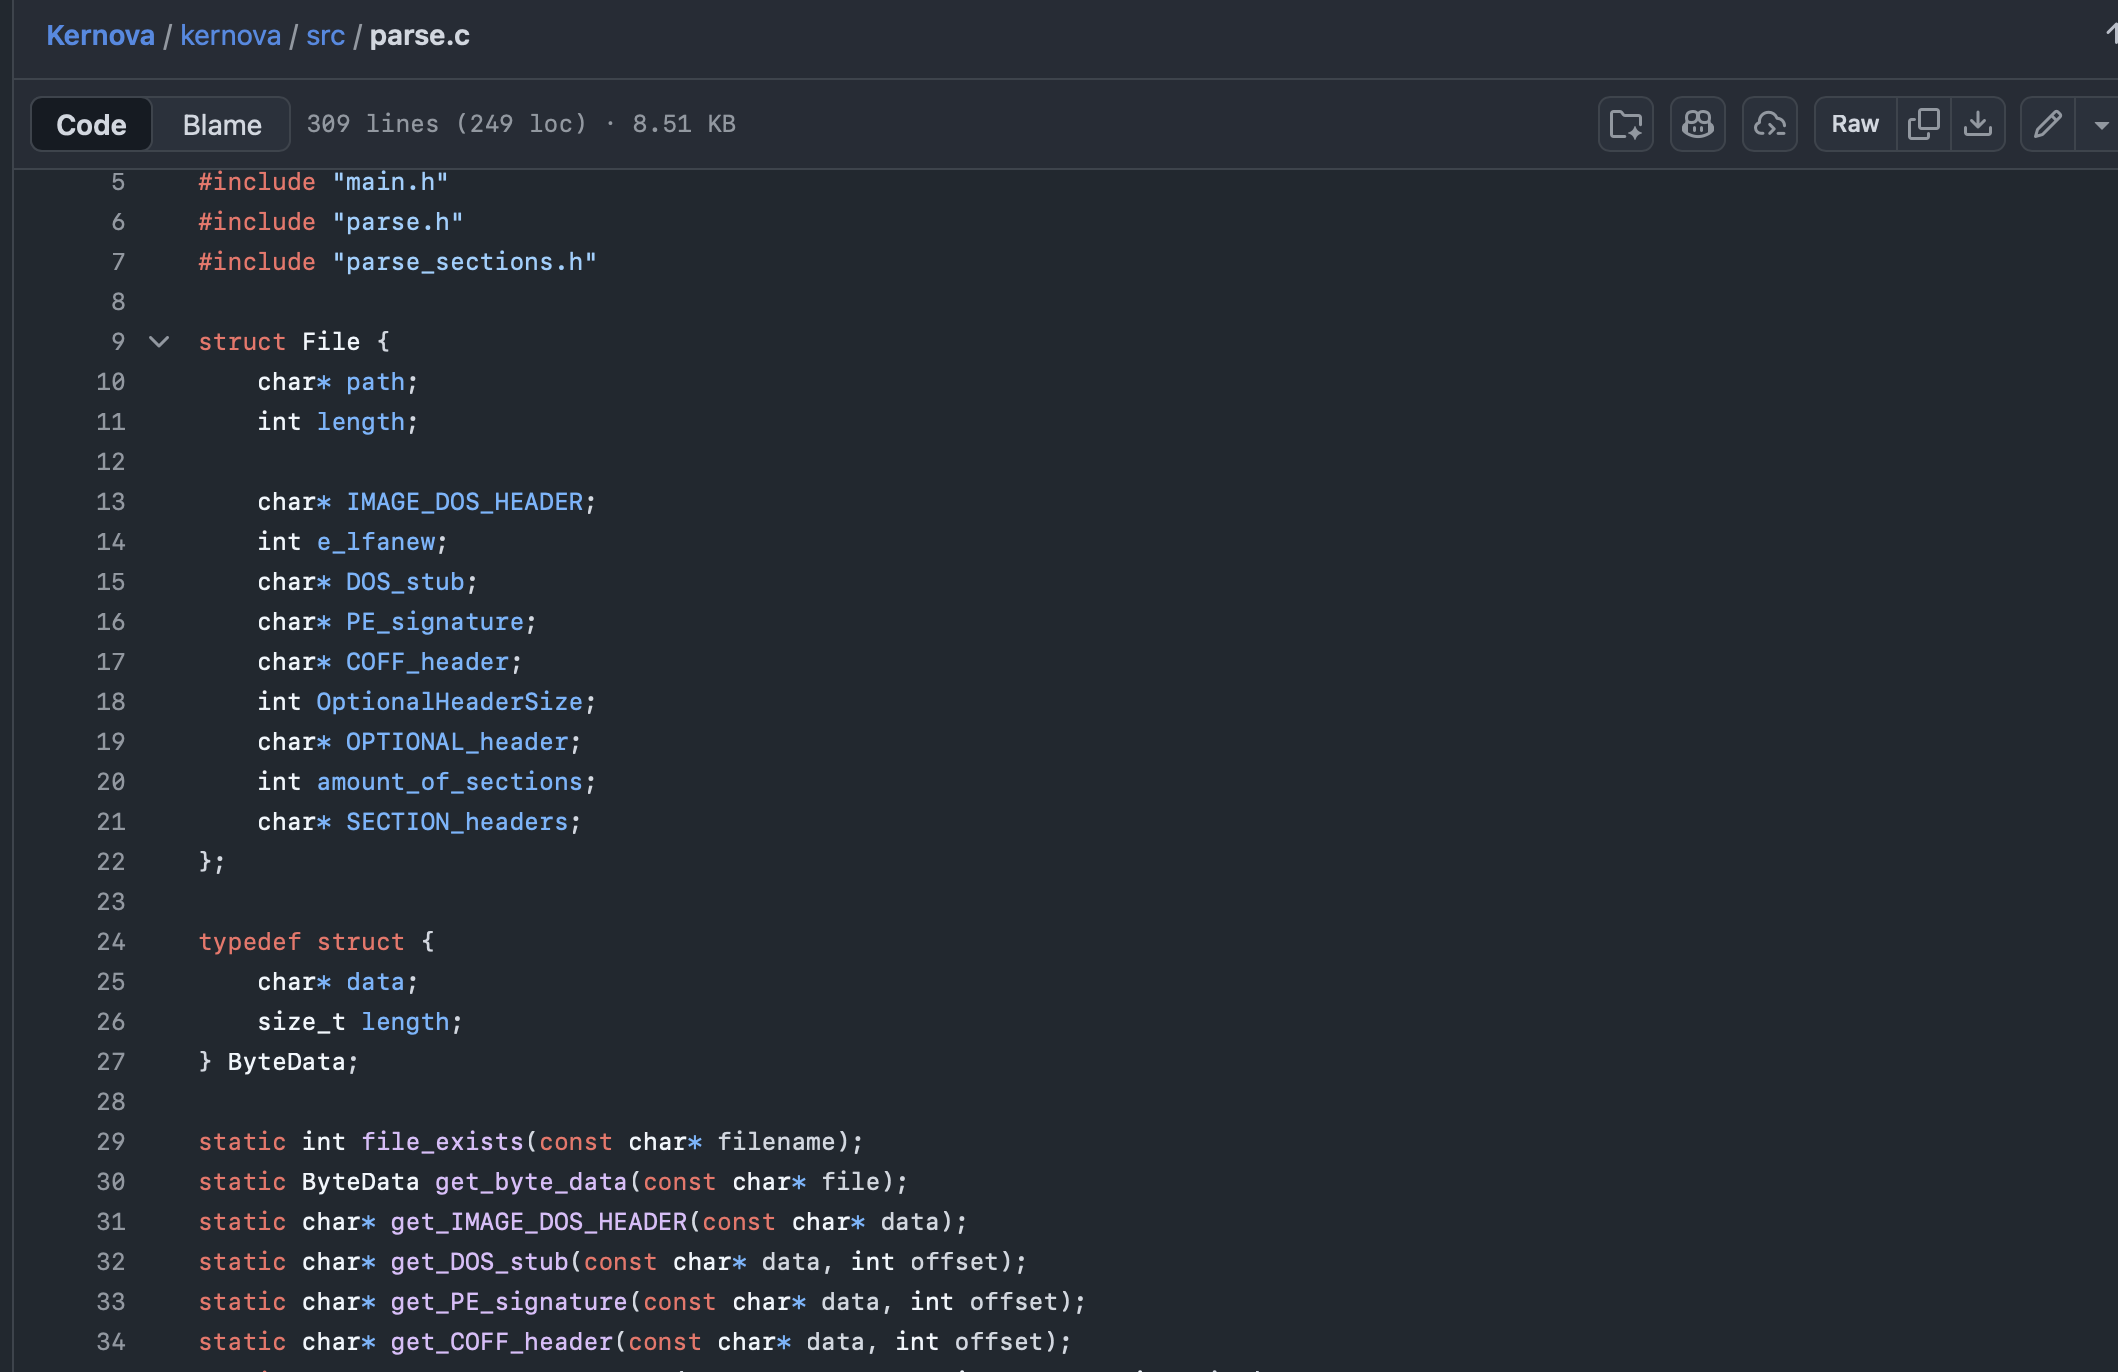
Kernova — Stealth Sandbox

Kernova sits between full virtual machines and basic sandboxes: a single‑application runtime that executes Windows binaries in a controlled environment while allowing carefully chosen pass‑through to the host. The focus is fidelity, low overhead, and visibility — with logging, breakpoints, and memory tooling built in.

Quick Summary

Kernova is a lightweight, high‑fidelity sandbox for Windows executables: it parses a target binary, runs it through a controlled execution engine, and selectively passes through specific operations while adding logging and breakpoints. The result is VM‑like control for a single application, without the usual VM overhead.

Implementation & Languages

Kernova is written in C, aiming for small binaries, predictable performance, and direct control over low-level execution.

Core idea: parse a Windows executable, build its memory layout, then execute the program via a controlled engine that can log and break at key points.

Selective pass-through: when the program needs OS functionality, Kernova can route specific operations through to the host while instrumenting them.

Memory tooling: inspect and modify process memory from the outside of the target’s “normal” execution path, reducing reliance on user-mode hooks.

Build & Portability

Current work is focused on a proof-of-concept that can analyze Windows executables even on non-Windows hosts, then carry the same approach to a full Windows runtime.

  • POC parsing: detect whether a target is 32-bit or 64-bit and enumerate constants and initial values.
  • Windows build: move from analysis-only to controlled execution with host pass-through and instrumentation.
  • Performance: keep it single-application and minimal to avoid VM-level overhead.

Overview

Kernova is smaller than a full VM but more powerful than a basic sandbox. It aims to emulate enough of the Windows kernel-facing behaviour to keep targets behaving normally, while still allowing direct host pass-through for specific operations.

Instead of relying purely on traditional user-mode hooks, Kernova’s model is “controlled execution + selective pass-through”: run the program under an execution engine, and only allow the operations you choose — with logging and breakpoints attached.

The Problem

Traditional sandboxes can be noisy and detectable, while full VMs add overhead and complexity. Kernova targets the middle ground: high fidelity, tight control, and strong introspection — focused on one application at a time.

What It Does

Executable Parsing

Parse Windows executables (PE), determine 32-bit vs 64-bit targets, and extract key constants and initial values.

Controlled Execution

Run the program through an execution engine that can step, trace, and enforce which operations are allowed.

Selective Pass-Through

Allow specific OS interactions to pass through to the host while attaching logging, breakpoints, and policy checks.

Memory Inspection

View and edit target memory as a first-class feature, without depending on in-process user-mode hooks.

Low Overhead

A “VM for one application” approach aims for minimal performance cost compared to full system virtualization.

Drivers (Planned)

Longer-term goal: support both user-mode applications and drivers under the same controlled runtime model.

Key Benefits

Harder to Spot

Because the target runs under a controlled engine with selective pass-through, Kernova reduces reliance on obvious in-process hooks.

Stronger Introspection

Breakpoints, tracing, and memory tooling are built into the runtime, making analysis and debugging straightforward.

Practical Performance

Focused on a single application at a time, aiming for far less overhead than full VM-based approaches.

Architecture (Conceptual)

PE Loader & Memory Map

Parses the executable, resolves architecture (x86/x64), lays out memory, and initializes state.

Execution Engine

Steps machine instructions under a controlled loop, enabling tracing, breakpoints, and policy enforcement.

Pass-Through Layer

Routes selected operations to the host OS while instrumenting and auditing each boundary crossing.

Instrumentation & Logging

Structured event output for key operations (API boundary calls, memory changes, faults, and notable behaviours).

Memory Tools

Inspect and modify memory in a controlled way, designed to minimize detectable hooking patterns.

Driver Support (Planned)

Extend the model beyond user-mode apps to handle drivers with the same core containment + observability strategy.

UI & Workflow

Provide a clean run workflow: load target, observe execution, and export logs/artifacts for analysis.

Data Flows

  1. Load & Classify

    The runtime parses the executable, determines whether it’s 32-bit or 64-bit, and prepares its initial memory state.

  2. Execute Under Control

    The program runs under a controlled execution loop that can trace instructions and enforce policies.

  3. Cross Boundaries

    When OS functionality is needed, Kernova selectively passes through specific operations and instruments the boundary.

  4. Inspect Memory

    Memory can be viewed and edited as part of the runtime workflow, without relying on in-process hooks.

  5. Record Events

    Key operations and anomalies are recorded as structured events for later review.

  6. Review & Export

    After execution, logs and artifacts can be reviewed and exported for debugging and analysis.

Event Types

Loader
PE parsed, arch detected, sections mapped
Execution
step, trace, breakpoints, faults
Pass-Through
allowed ops, blocked ops, policy decisions
Memory
reads/writes, edits, regions, markers
Host I/O
filesystem, registry, networking (if enabled)
Anomalies
violations, unexpected behaviour, crashes

Abstraction & Fidelity Strategy

Model enough Windows behaviour to keep targets stable and believable, but keep the runtime small: execute under control, then selectively pass through only the operations you explicitly allow.

Where possible, prefer boundary-level instrumentation over in-process hooks. Keep logging and breakpoints attached to the execution engine so visibility remains consistent even when the target is hostile to hooking.

Build Plan & Phases

Phase 0 — Proof of Concept

Executable parsing: detect x86/x64, enumerate memory constants and initial values, and validate PE handling (even on non-Windows hosts).

Phase 1 — User-Mode Runtime

Controlled execution engine for user-mode targets: step/trace, breakpoints, and a minimal pass-through surface.

Phase 2 — Instrumentation

Logging and policy: record boundary crossings, enforce allow/deny rules, and add exportable run artifacts.

Phase 3 — Memory Workflow

First-class memory view/edit tooling integrated into the run workflow, designed to minimize detectable hooking patterns.

Phase 4 — Drivers (Stretch)

Explore bringing drivers into the same model: stronger containment boundaries and expanded emulation/pass-through decisions.

MVP Checklist

  • Parse PE executables and classify x86/x64
  • Build initial memory map and state
  • Controlled execution loop (step/trace)
  • Selective pass-through for chosen operations
  • Logging + breakpoints at key boundaries
  • Memory view/edit tooling

Demo Plan

  • Load a Windows executable and show x86/x64 detection
  • Show extracted constants / initial values
  • Start controlled execution and hit a breakpoint
  • Demonstrate memory view/edit during runtime
  • Show a pass-through decision (allowed vs blocked)
  • Export logs/artifacts for review

Follow progress on GitHub

Open Repository